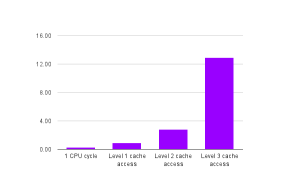
It is usually hard to get an idea of how the time taken for various fundamental operations varies, and it does matter, but it's hard to viscerally get it (time intervals in nanoseconds, microseconds, milliseconds aren't really felt in the same way).
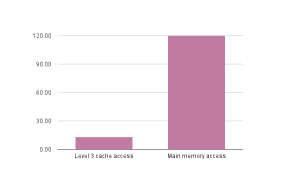
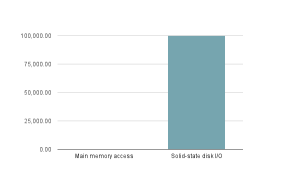
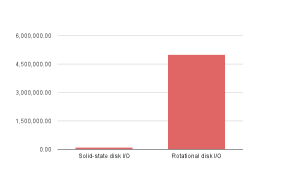
I came across this idea of representing the smallest number as a single second and everything else in terms of it, so that the relationship between the numbers is represented in more of a human scale, which results in the following table:
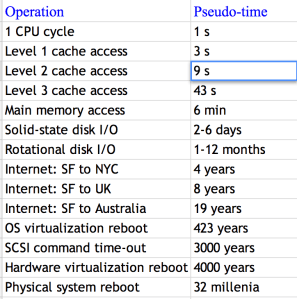
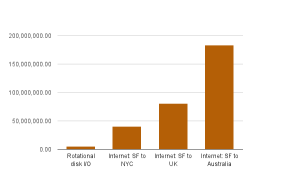
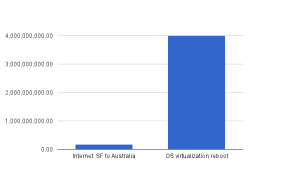
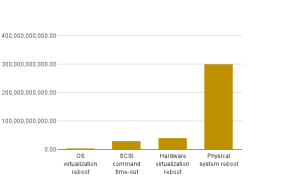
I wanted to show this in a chart, but it never shows more than the last two values, so I had to break it down into a series of smaller charts (I could use a log scale to represent them too, but that would've again lessened the impact you feel when seeing these numbers side by side)